by Hannah Vinueza McClellan, EducationNC
September 4, 2024
North Carolina public schools showed progress on school accountability measures during the 2023-24 school year, according to new data released by the Department of Public Instruction (DPI) on Wednesday.
In North Carolina, school grades are based on each school’s achievement score, weighted 80%, and on students’ academic growth, weighted 20%. Education leaders have long said that formula does not capture the full picture of the work happening in the state’s public schools.
“Over-reliance on tests and school performance grades can misrepresent school quality and mask both the growth and achievement of our students, as well as the challenges and obstacles they face,” State Board of Education Chair Eric Davis said at the start of Wednesday”s meeting. “Let’s use this data, not as a myopic judgment of school quality, but instead to inform and rededicate ourselves to our students and North Carolina’s public schools.”
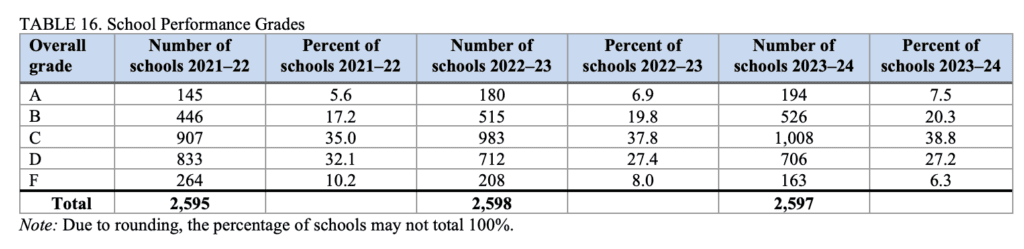
According to the new data, more than one in four schools received an A or B during the 2023-24 school year (27.8%), and nearly three-fourths of schools met or exceeded growth during the same time period (72.5%). Both measures increased from the previous school year.
Student standardized test scores account for the bulk of each school’s achievement score.
School growth, according to DPI, “is measured by a statistical model that compares each student’s predicted test score, based on past performance, against his or her actual result.”
“The data in the accountability report provides us with a clear picture of what’s going well in our schools and what areas need additional support,” state Superintendent Catherine Truitt said. “This year’s data shows us that we’re headed in the right direction in most areas, but that we must remain committed to advocating for additional support for our teachers.”
You can read DPI’s full report on testing and accountability here. Below, you can find a look at school performance grades over time, starting in 2021-22.
 Screenshot from DPI’s school accountability report.
Schools that receive a score of D or F, and which don’t exceed growth, are considered “low performing.” Low-performing districts are districts where more than 50% of schools are identified as low performing. Continually low-performing schools are schools identified as low performing in any two of the last three years.
The number of low-performing schools decreased by 68 schools last school year, DPI data shows, and the number of low-performing districts decreased by two.
In 2023-24, 33.5% of schools received a score of D or F — a decrease from 35.4% in 2022-23 and 42.3% in 2021-22.
“Regardless to where our schools and districts are, we want them to continue improving,” said Ron Dixon, DPI’s assistant superintendent of the Office of School Improvement.
As leaders across the state work to improve outcomes for students, some education leaders push back on the deficit focus of the “low-performing” framework.
Dr. Anthony Jackson, superintendent of Chatham County Schools, said his district makes an effort to recognize that there are high-performing students in every school, regardless of low-performing status. Additionally, he said schools should always center individual student needs, rather than a school’s overall ranking.
His district has also reframed the “low-performing” designation with different language.
“In Chatham County Schools, we avoid labeling schools as ‘low performing.’ Instead, we identify them as ‘Schools in Need of Support,’” Jackson previously told EdNC. “We collaborate with these schools to create targeted plans, leveraging their strengths and best practices while providing extra resources to address specific areas of improvement. As a school leader, I emphasize the power of words and a growth mindset.”
Typically, after DPI releases its school performance data, schools and districts have two weeks to review the data to make any corrections.
Once school performance grades are finalized, EdNC will publish interactive data visualizations of the data, with a look at specific schools and districts.
Context on school performance grades
As mentioned above, education leaders across the state have long advocated for a different method of measuring school performance.
Last February, Truitt presented DPI’s proposal for school performance grade redesign to lawmakers. To move forward, the model requires legislative action.
Under DPI’s proposed model, schools would receive four different grades:
Academics. Across all grades, this would measure proficiency in math, science, and reading.
Progress. This grade would measure a school’s growth, based on EVAAS data.
Readiness. Across K-12, this grade would measure postsecondary preparation. In middle school, it would also include career development plans. In high school, it would also include postsecondary outcomes and graduation rates.
Opportunity. This grade would measure chronic absenteeism, school climate, and intra/extra curricular activities.
“We have to do more than simply look at test scores that occur on one day of the year at the end of the year or semester,” Truitt said at the time. “We must absolutely be as transparent as possible about the percentage of students who are proficient in reading and proficient math, but there has to be more than that.”
The education reform committee’s final report from last long session recommended approving DPI’s recommended model, but by creating one summative grade, rather than four.
House Bill 1057, School Performance Grade Pilot, filed by Republicans in May, would direct DPI to develop criteria “for a new school performance grade metric and method.” Under the bill, a pilot for the new system would have launched for a few schools during the 2024-25 school year. By 2025-26, it would be expanded to all schools.
The bill said the General Assembly’s intent is that the new model would include “a single summative school performance grade be issued with fifty percent (50%) of the weighted score being determined by student performance, thirty percent (30%) of the weighted score being determined by student growth, and the remaining twenty percent (20%) of the weighted score being determined” by DPI.
The bill was not passed before lawmakers adjourned for the session.
On Wednesday, Truitt said again that school performance grades are not “truly indicative of school quality or student success.”
“But we still need to remember that we’re not just focused here on school performance grades. We also need to be focused on proficiency levels,” Truitt said. “And these proficiency levels are just startling. They were startling before the pandemic, and they remain startling.”
Truitt specifically noted the gaps in performance in math and reading for minority students. DPI and the Board must continue to advocate for for updating school performance models, she said, which also working to “ensure all students have a chance to be proficient.”
EdNC will publish an article soon looking at new test scores released this week. For now, you can look at an overview of the findings from DPI.
(function (c, i, t, y, z, e, n, x) { x = c.createElement(y), n = c.getElementsByTagName(y)[0]; x.async = 1; x.src = t; n.parentNode.insertBefore(x, n); })(document, window, ” “script”);
More highlights from the report
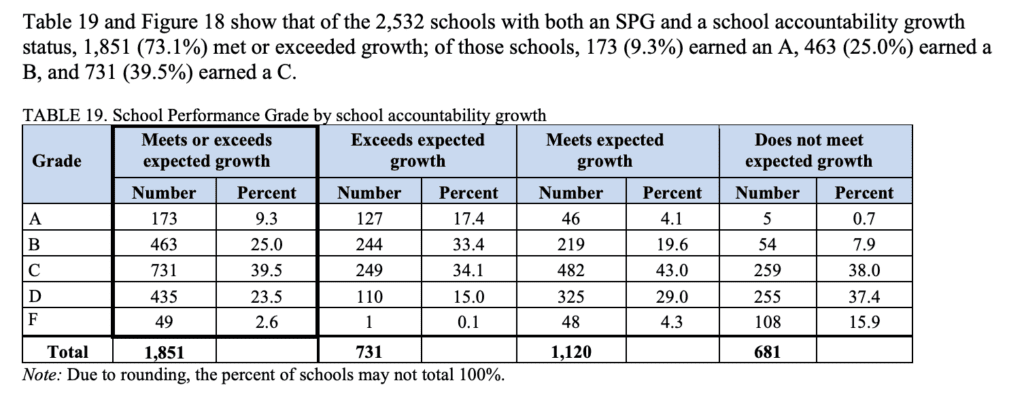
During the 2023-24 school year, 1,851 schools met or exceeded growth (73.1%).
The table below shows what letter score each school received, sorted by the school’s growth rate. Note that 26.1% of schools that met or exceeded growth last school year received a grade of D or F — school growth only makes up 20% of the composite performance score.
 Screenshot from DPI’s report on school accountability.
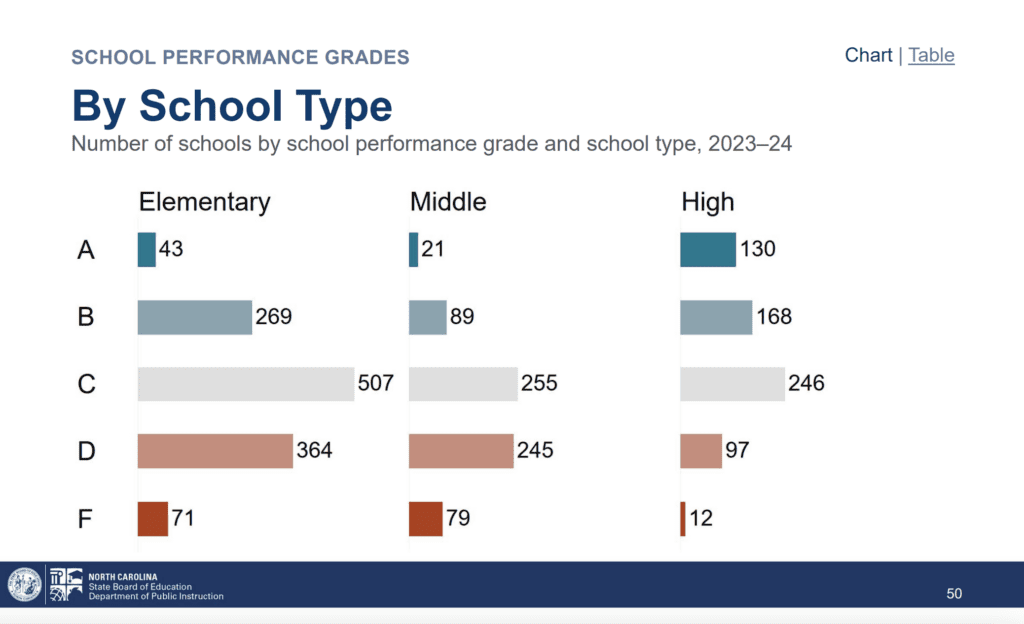
The report also separates school performance grades by school type — elementary, middle, and high.
High schools have a larger proportion of schools with grades of A or B. However, high schools have more indicators than middle and elementary schools, because high school students take a larger number of standardized tests.
“They have more information than elementary and middle schools,” said Dr. Tammy Howard, senior director of the Office of Accountability and Testing.
 Screenshot from DPI’s presentation on school performance grades.
The percentage of English Language Learners (EL) who meet their progress targets is also included in a school’s performance grade.
“There has been a steady increase in the percentage of students meeting progress targets or exiting English learner status over the past three years,” DPI’s press release said.
During the 2023-24 school year, 27.3% of EL students met targets — up from 24.9% in 2022-23 and 21.1% in 2021-22.
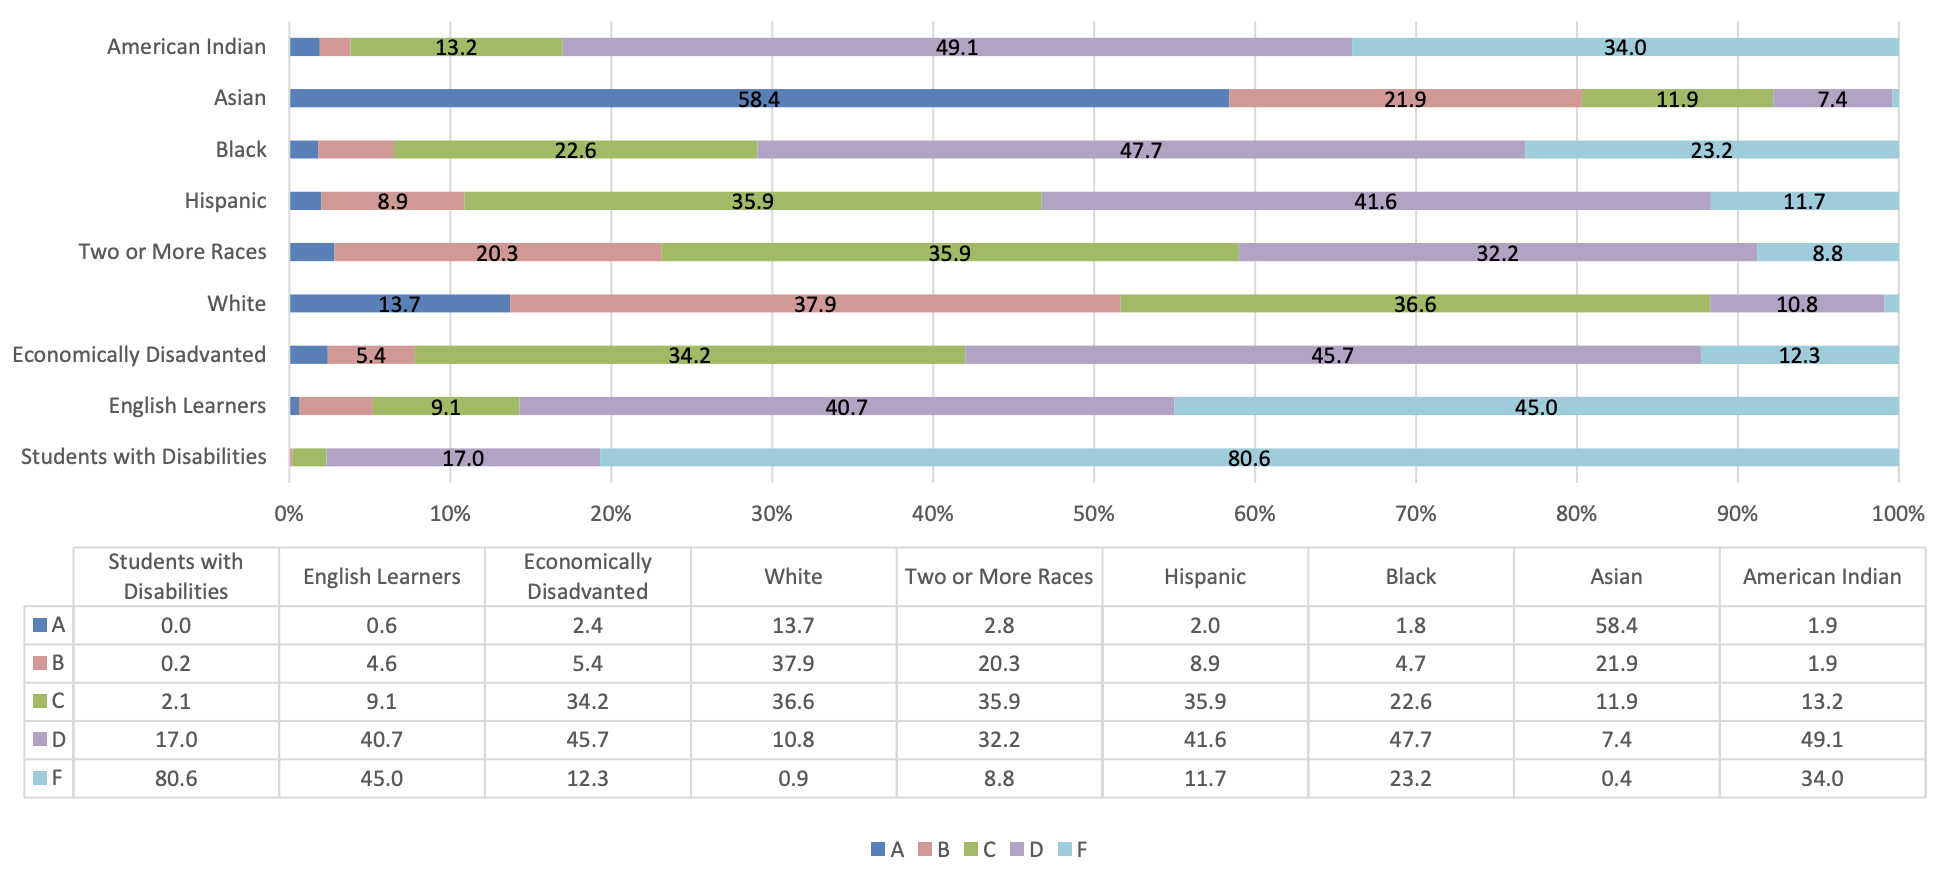
The DPI report also includes analysis for student subgroups, including students with disabilities, English learners, economically disadvantaged students, and white, Hispanic, Black, Asian, and American Indian students. To receive a letter grade a subgroup must have 30 students in membership in the school, Howard said in an email to EdNC.
According to the data, white and Asian subgroups perform at a higher rate than schools overall, while other groups perform at much lower rates. This is consistent with DPI’s test score data, also presented to the Board on Wednesday.
 Screenshot from DPI’s school accountability report.
Board members discussed at length the need to do something different to improve outcomes for minority students, including staffing, teacher support, and advocacy for a new accountability model — which would hopefully include more funding to support student needs.
The Board will continue discussing these results next month, Davis said.
“This is a conversation that needs to continue,” he said. “Let’s build on the comments that have been made, and let’s dig deeper into assessing and analyzing the data to try to figure out how we get better.”
This article first appeared on EducationNC and is republished here under a Creative Commons license.
Source link : http://www.bing.com/news/apiclick.aspx?ref=FexRss&aid=&tid=66d9721d0de9459ca2057a8f8e522a08&url=https%3A%2F%2Fwww.ednc.org%2F09-04-2024-north-carolina-releases-school-performance-grades-for-2023-24-heres-what-you-need-to-know%2F&c=11977070198656217844&mkt=en-us
Author :
Publish date : 2024-09-04 07:52:00
Copyright for syndicated content belongs to the linked Source.