
Purchasing a home is one of the most important investments there is. More than a place to live, homeownership is an asset with the potential to tremendously rise in value. But with home prices reaching record heights, affordability plays a huge role for buyers.
The typical home value in the United States was $362,156 in July, 2.8% higher than the year before.
High mortgage rates are also making monthly payments more expensive; as of Aug. 22, the 30-year fixed mortgage rate sits at 6.46%.
Although home prices have inflated all across the U.S., there are some cities that command a higher price tag than others. Location, size, age, and condition are all contributing factors to home value.
Stacker compiled a list of cities with the most expensive homes in Rhode Island using data from Zillow. Cities are ranked by the Zillow Home Values Index for all homes as of July 2024. The charts in this story were created automatically using Matplotlib.
You may also like: Most popular car colors in Rhode Island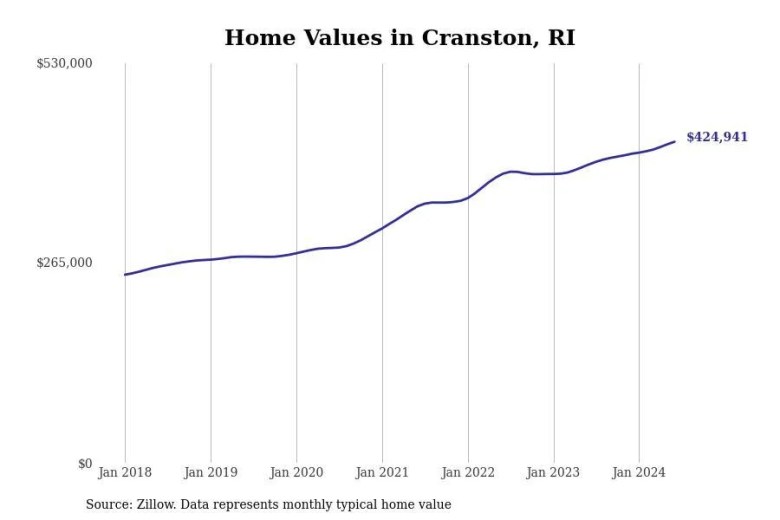
Stacker#30. Cranston
– Typical home value: $428,241
– 1-year price change: +7.5%
– 5-year price change: +57.0%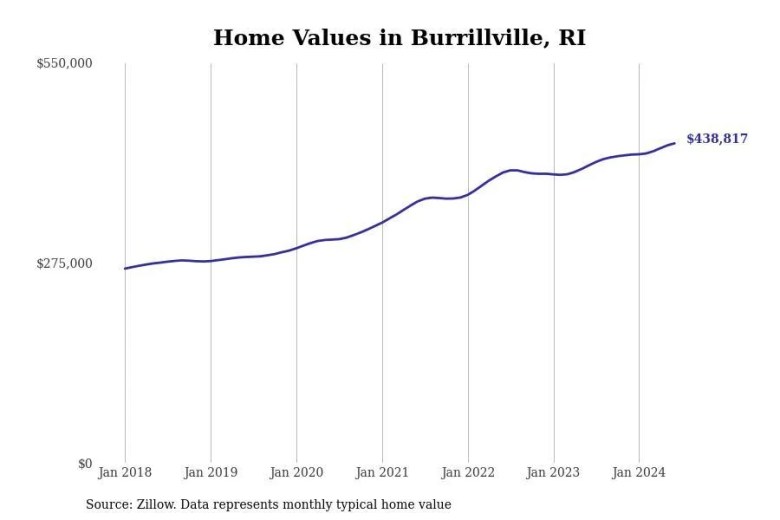
Stacker#29. Burrillville
– Typical home value: $440,860
– 1-year price change: +6.7%
– 5-year price change: +55.7%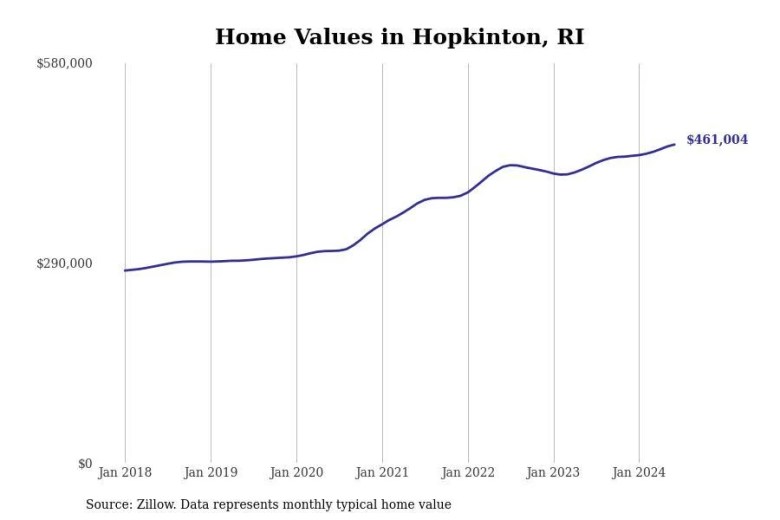
Stacker#28. Hopkinton
– Typical home value: $464,202
– 1-year price change: +6.9%
– 5-year price change: +57.9%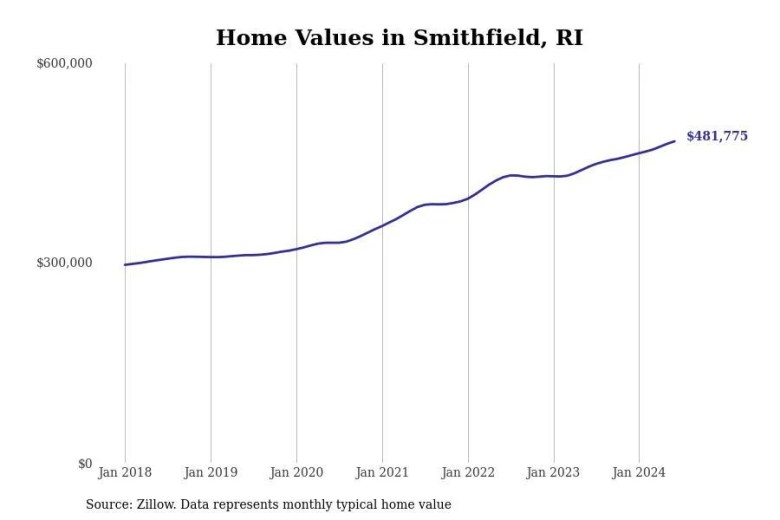
Stacker#27. Smithfield
– Typical home value: $484,975
– 1-year price change: +8.3%
– 5-year price change: +55.8%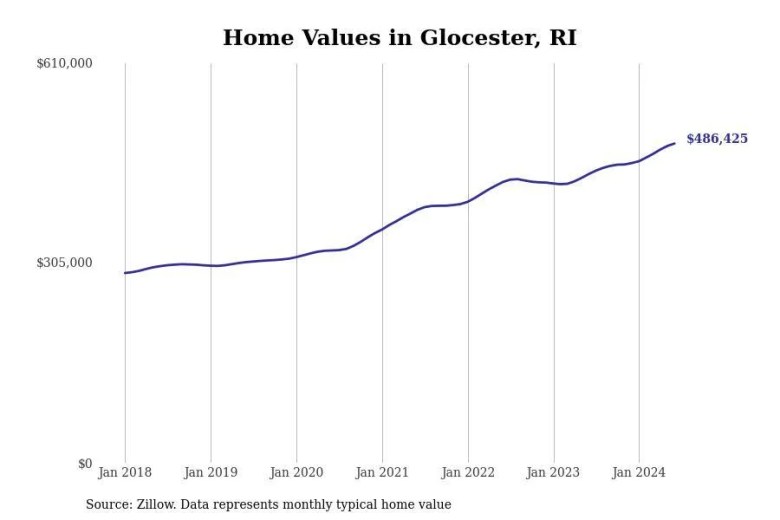
Stacker#26. Glocester
– Typical home value: $489,641
– 1-year price change: +10.0%
– 5-year price change: +59.7%
You may also like: Highest-rated beer in Rhode Island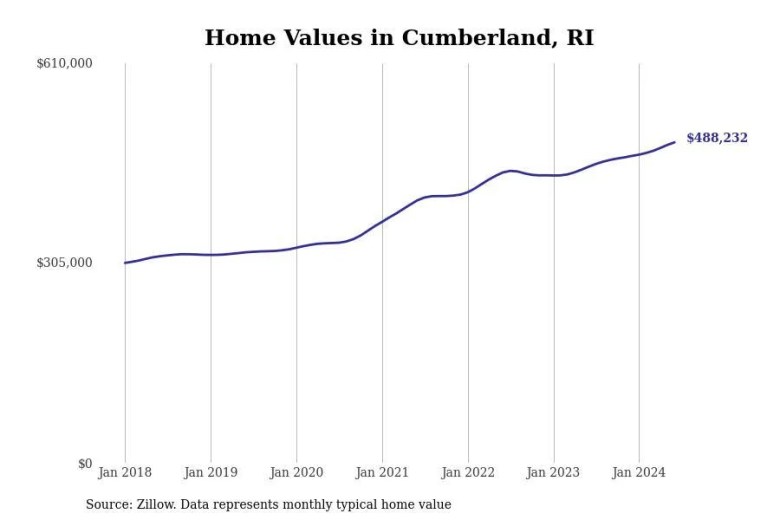
Stacker#25. Cumberland
– Typical home value: $491,659
– 1-year price change: +8.0%
– 5-year price change: +53.0%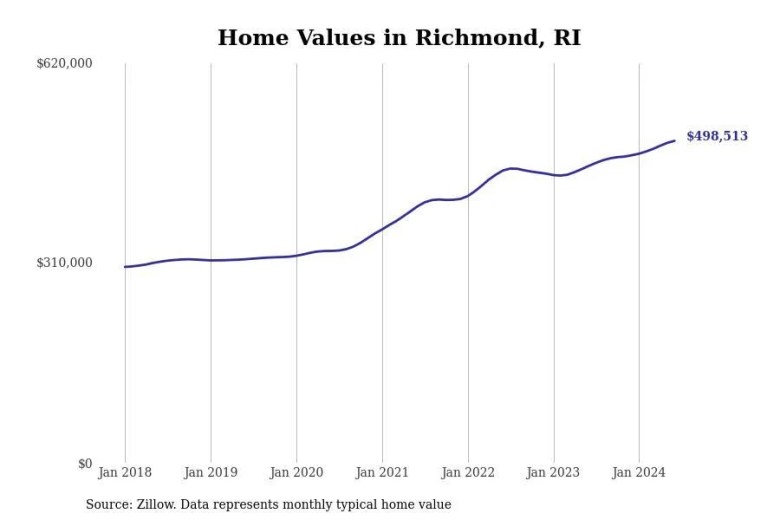
Stacker#24. Richmond
– Typical home value: $501,271
– 1-year price change: +8.0%
– 5-year price change: +58.6%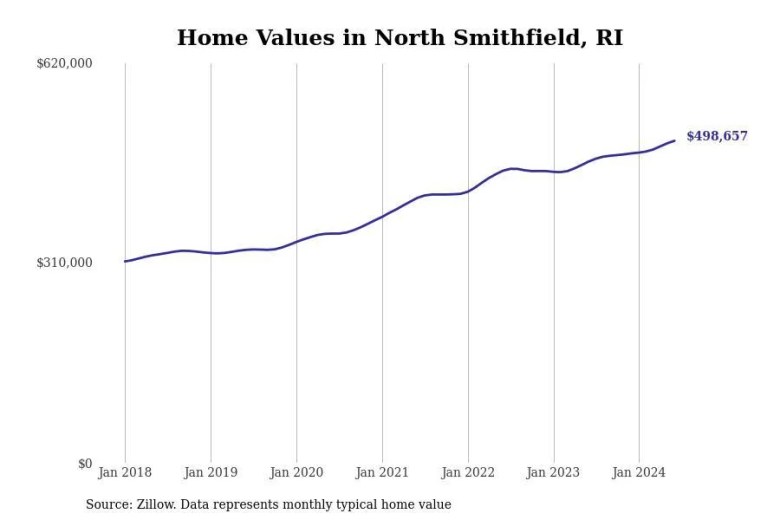
Stacker#23. North Smithfield
– Typical home value: $501,772
– 1-year price change: +6.5%
– 5-year price change: +51.9%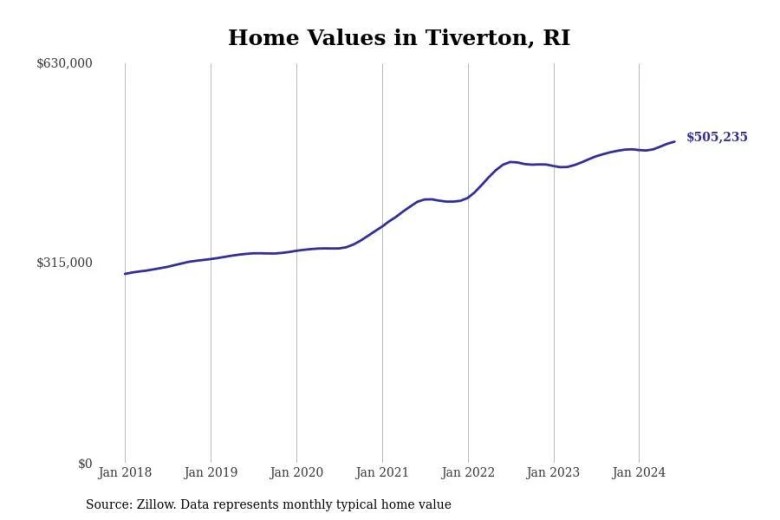
Stacker#22. Tiverton
– Typical home value: $507,885
– 1-year price change: +5.3%
– 5-year price change: +54.1%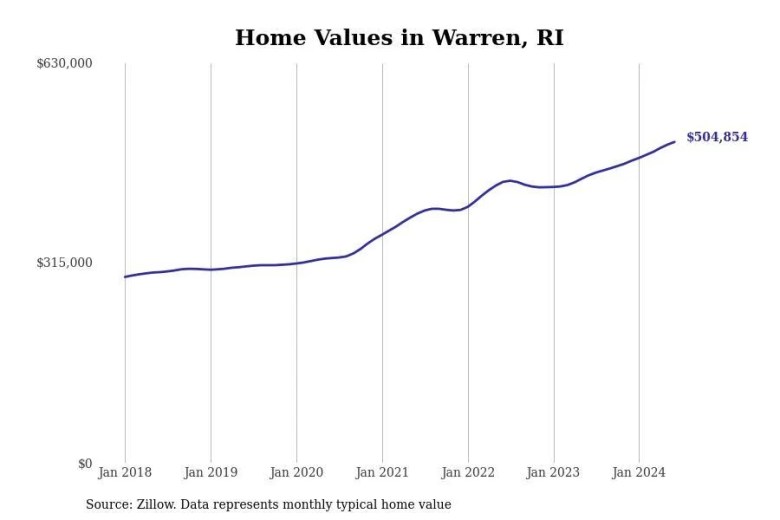
Stacker#21. Warren
– Typical home value: $508,092
– 1-year price change: +11.3%
– 5-year price change: +63.8%
You may also like: How compensation compares between Rhode Island staff and travel nurses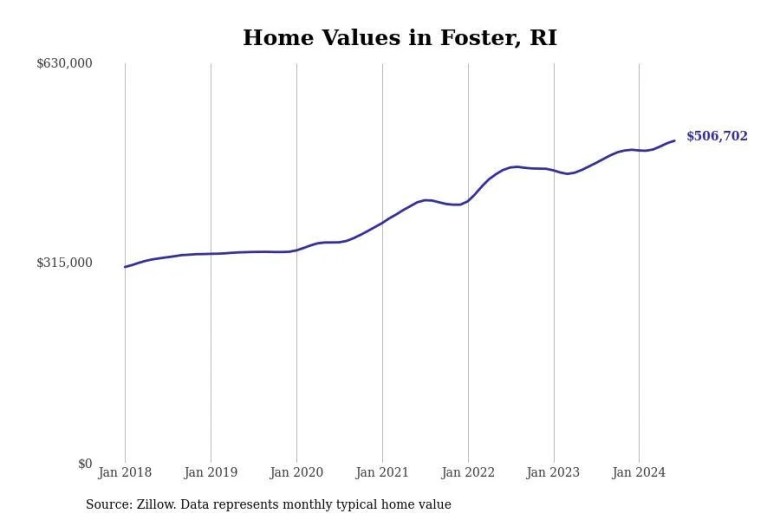
Stacker#20. Foster
– Typical home value: $509,242
– 1-year price change: +7.9%
– 5-year price change: +53.5%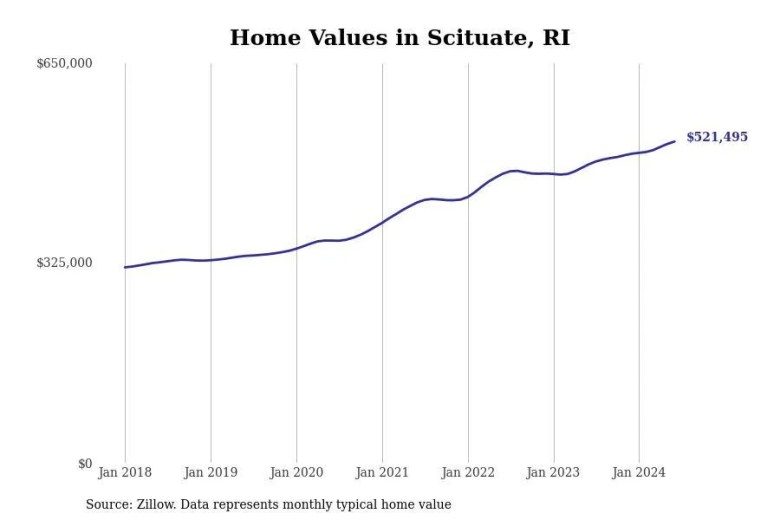
Stacker#19. Scituate
– Typical home value: $524,377
– 1-year price change: +7.2%
– 5-year price change: +55.8%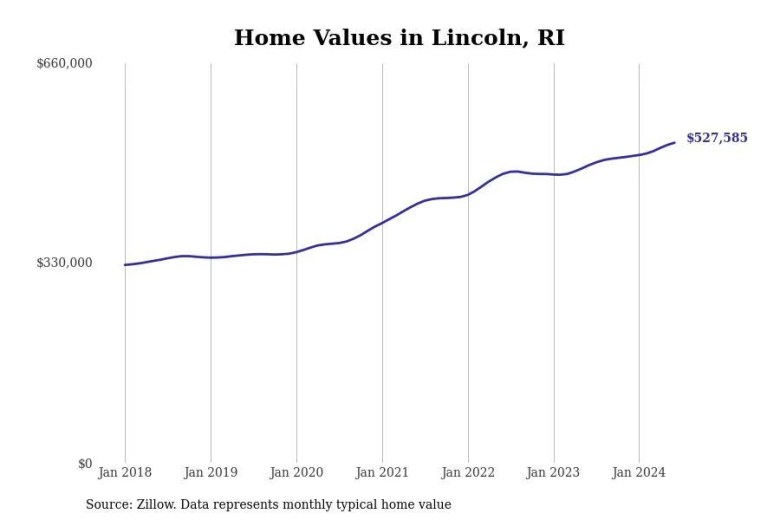
Stacker#18. Lincoln
– Typical home value: $530,575
– 1-year price change: +7.2%
– 5-year price change: +54.4%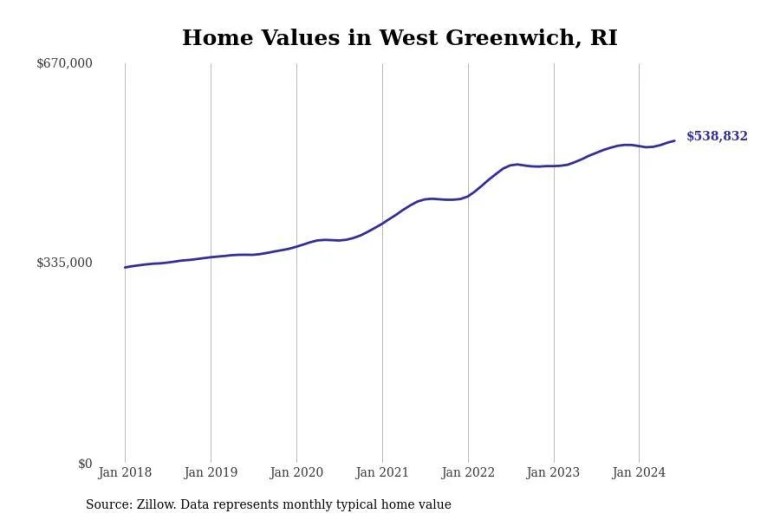
Stacker#17. West Greenwich
– Typical home value: $541,752
– 1-year price change: +4.5%
– 5-year price change: +55.7%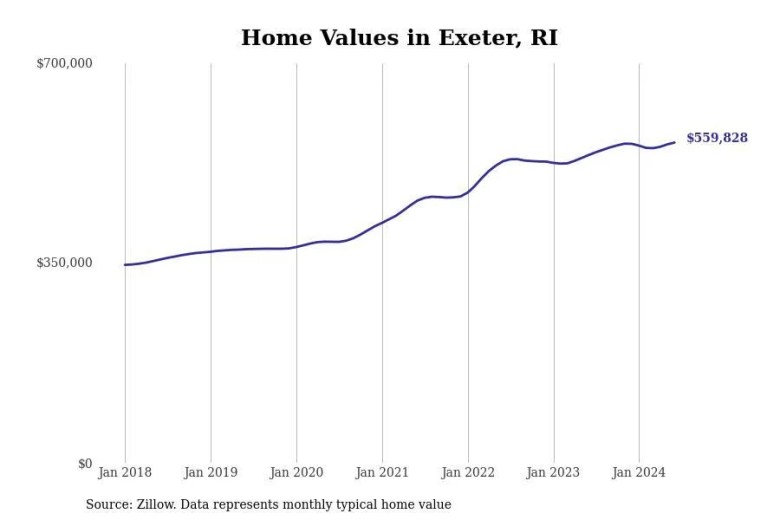
Stacker#16. Exeter
– Typical home value: $563,283
– 1-year price change: +3.7%
– 5-year price change: +50.7%
You may also like: Best scenic drives in Rhode Island
Stacker#15. Westerly
– Typical home value: $565,959
– 1-year price change: +5.9%
– 5-year price change: +58.9%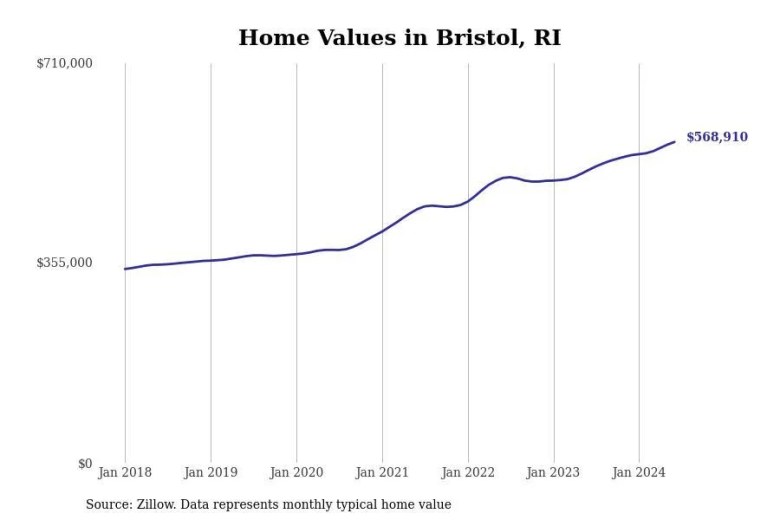
Stacker#14. Bristol
– Typical home value: $572,636
– 1-year price change: +9.0%
– 5-year price change: +55.7%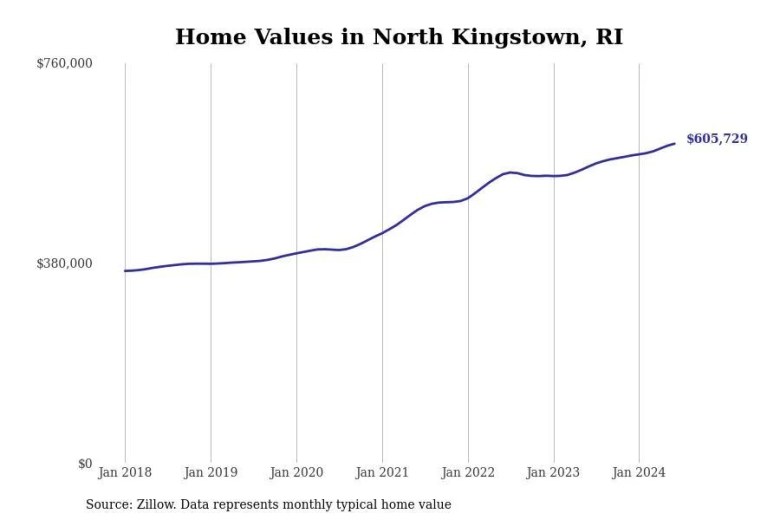
Stacker#13. North Kingstown
– Typical home value: $609,509
– 1-year price change: +7.3%
– 5-year price change: +59.4%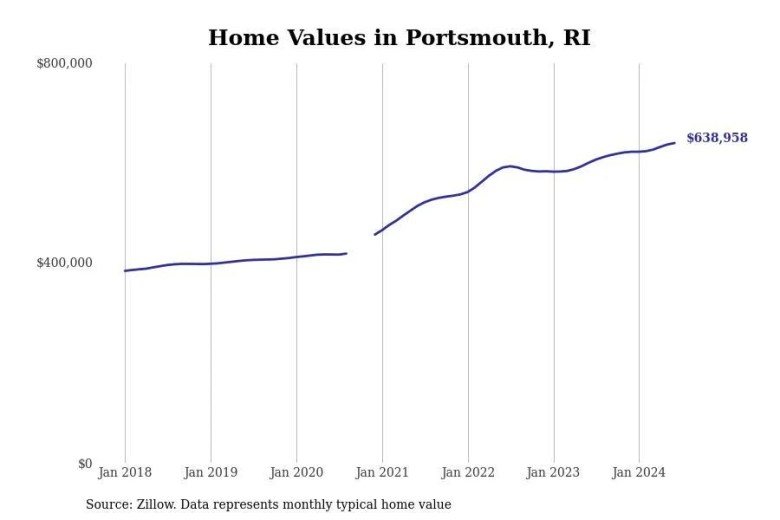
Stacker#12. Portsmouth
– Typical home value: $640,874
– 1-year price change: +5.8%
– 5-year price change: +58.1%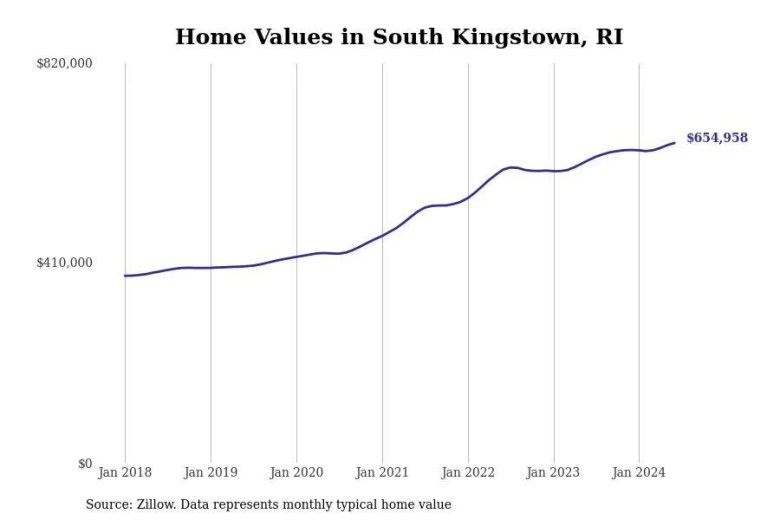
Stacker#11. South Kingstown
– Typical home value: $659,116
– 1-year price change: +5.2%
– 5-year price change: +63.3%
You may also like: Demand for these health care jobs is increasing most in Rhode Island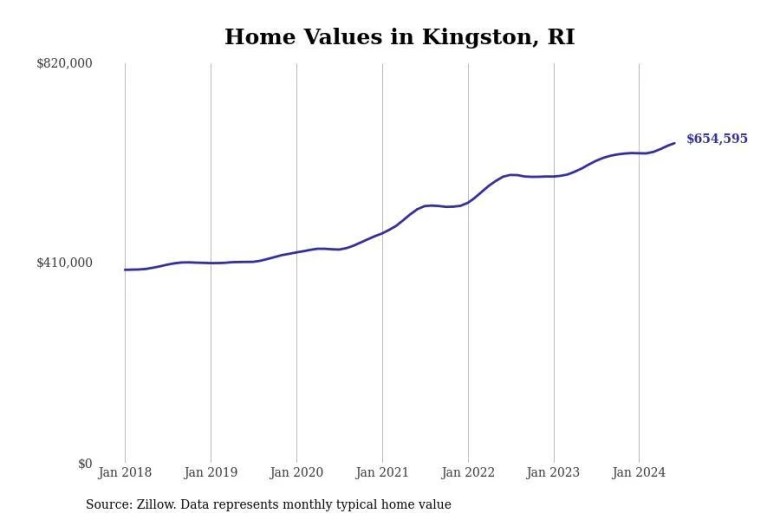
Stacker#10. Kingston
– Typical home value: $659,605
– 1-year price change: +6.7%
– 5-year price change: +60.3%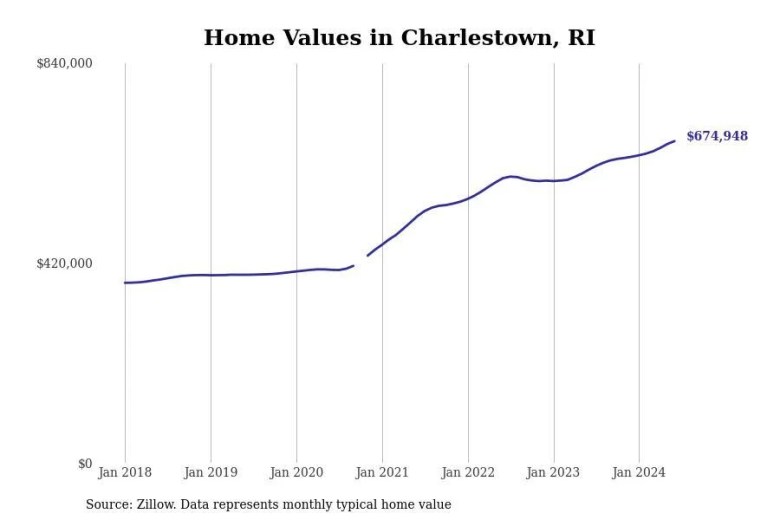
Stacker#9. Charlestown
– Typical home value: $678,964
– 1-year price change: +9.0%
– 5-year price change: +72.0%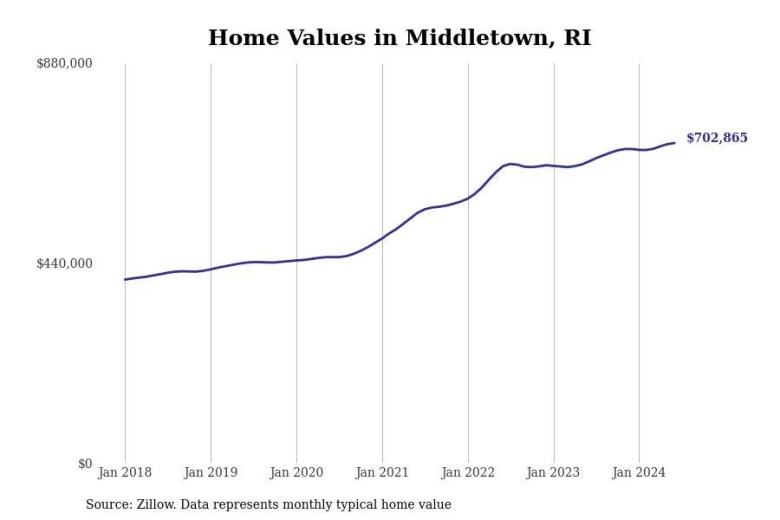
Stacker#8. Middletown
– Typical home value: $704,628
– 1-year price change: +5.3%
– 5-year price change: +59.7%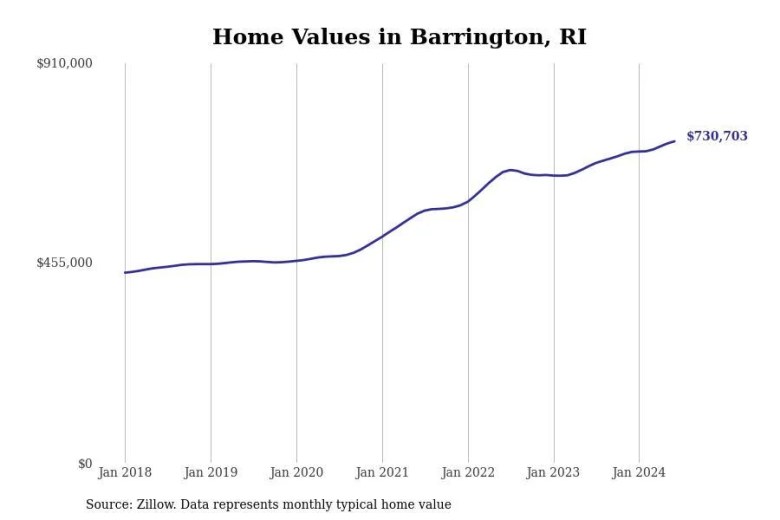
Stacker#7. Barrington
– Typical home value: $734,803
– 1-year price change: +7.8%
– 5-year price change: +60.4%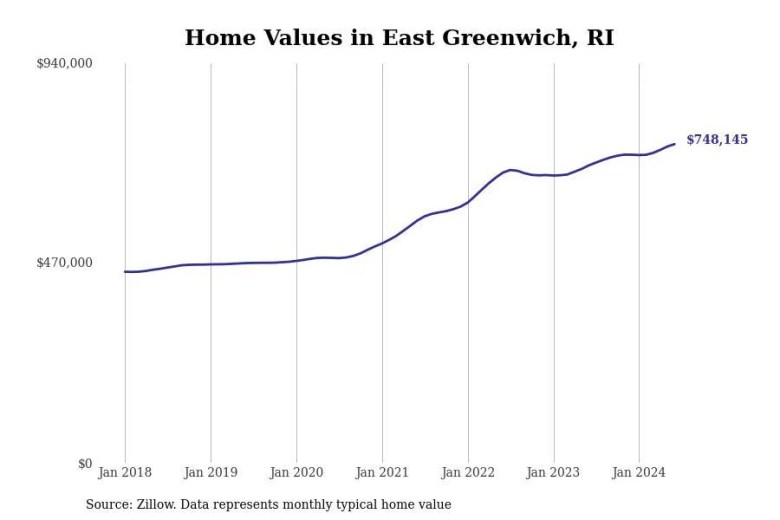
Stacker#6. East Greenwich
– Typical home value: $752,360
– 1-year price change: +6.8%
– 5-year price change: +60.3%
You may also like: Risky reservoirs: Rhode Island counties where aging dams pose the greatest threat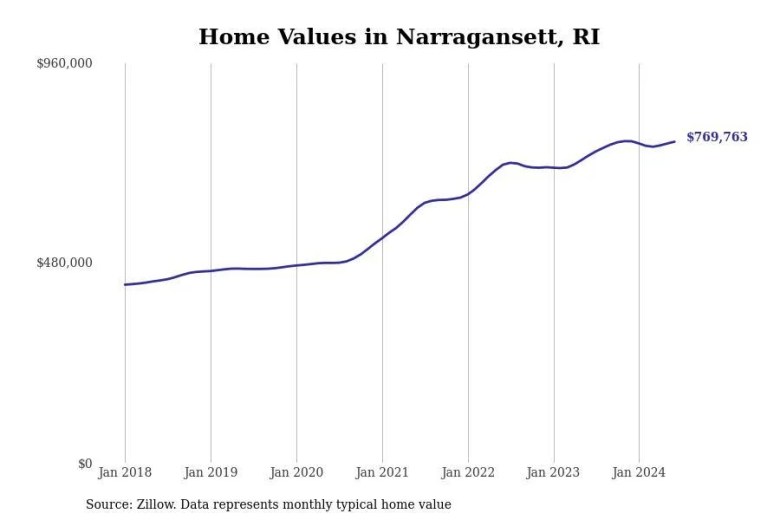
Stacker#5. Narragansett
– Typical home value: $774,200
– 1-year price change: +3.7%
– 5-year price change: +66.6%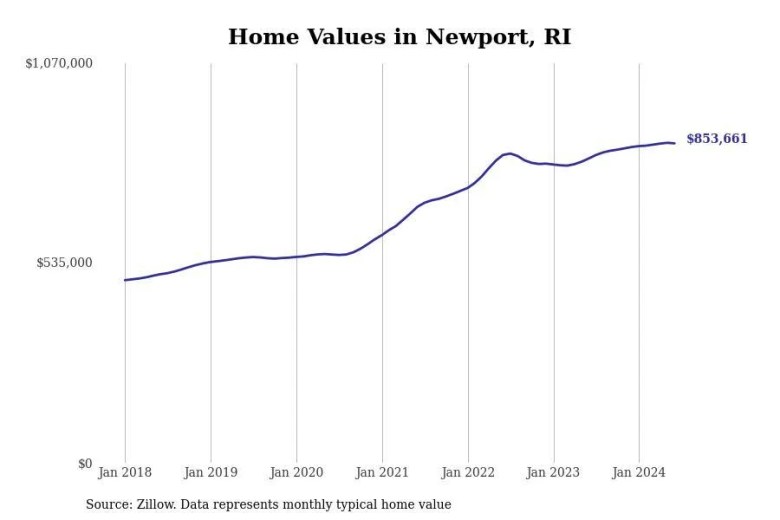
Stacker#4. Newport
– Typical home value: $852,897
– 1-year price change: +3.7%
– 5-year price change: +55.1%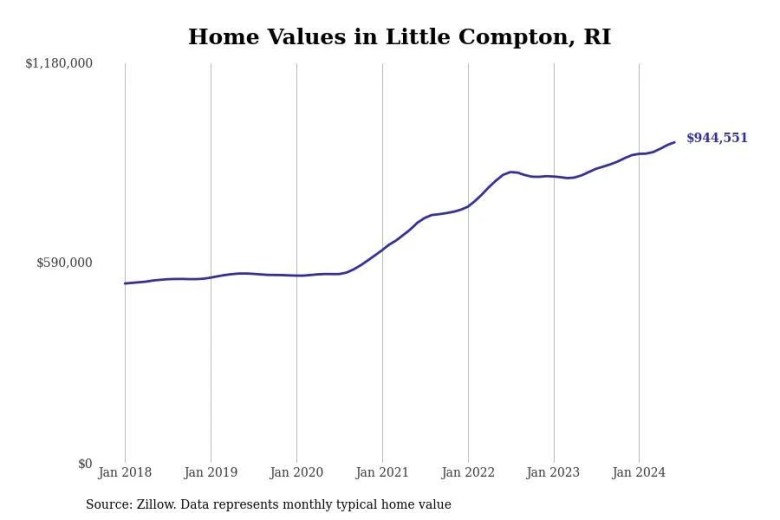
Stacker#3. Little Compton
– Typical home value: $948,390
– 1-year price change: +9.5%
– 5-year price change: +70.3%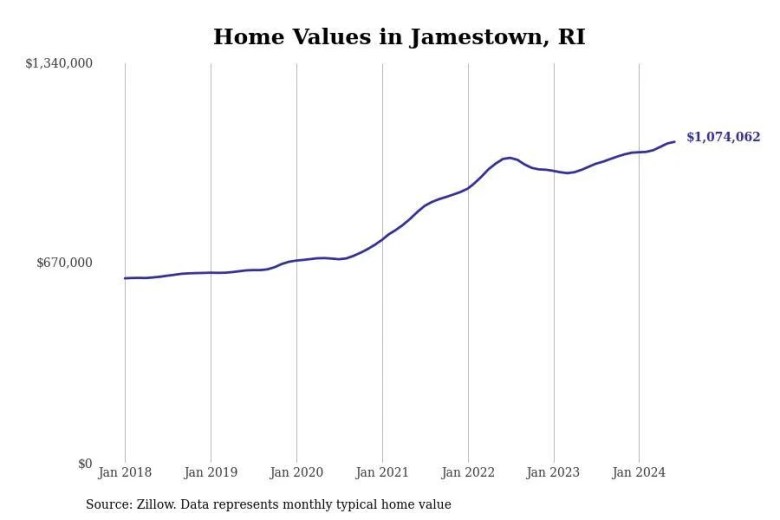
Stacker#2. Jamestown
– Typical home value: $1,075,819
– 1-year price change: +7.5%
– 5-year price change: +66.8%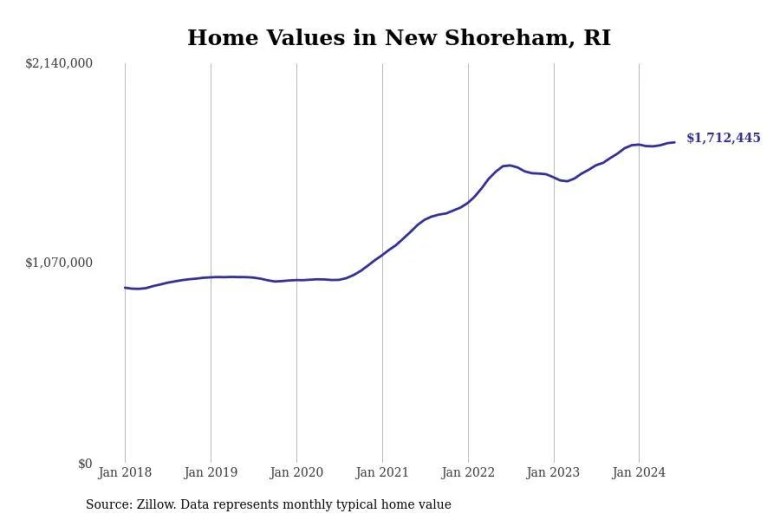
Stacker#1. New Shoreham
– Typical home value: $1,716,081
– 1-year price change: +7.9%
– 5-year price change: +73.3%
This story features data reporting and writing by Elena Cox and is part of a series utilizing data automation across 50 states.
You may also like: Highest-rated things to do in Rhode Island, according to Tripadvisor
More From What’sUpNewp
Load more posts
Something went wrong. Please refresh the page and/or try again.
Source link : http://www.bing.com/news/apiclick.aspx?ref=FexRss&aid=&tid=66c9fdeabffa45eb9e968da76df47ea1&url=https%3A%2F%2Fwhatsupnewp.com%2F2024%2F08%2Frhode-islands-priciest-real-estate-cities-and-towns-with-sky-high-home-values%2F&c=13039064133345112160&mkt=en-us
Author :
Publish date : 2024-08-24 03:00:00
Copyright for syndicated content belongs to the linked Source.