This story first appeared in Ann Doss Helms’ weekly education newsletter. Sign up here Sign up here to get it to your inbox first.
In about a month, North Carolina’s Department of Public Instruction will release mountains of data on how students in public schools performed last year. There will be multiple spreadsheets slicing and dicing test scores and graduation rates.
And then it will all be crunched into one simple label: An A-to-F school performance grade.
The raw data is overwhelming for all but the most dedicated analysts. The letter grades are ridiculously simple.
Data-driven accountability has been a central theme in the 22 years I’ve covered education. As best I can tell, it has four main goals:
Evaluating student performance.Evaluating educator performance.Allowing people to compare schools and districts.Informing public policy.
I’ve been part of the quest to parse meaning from the numbers and present data in ways people can understand. It hasn’t been easy.
Technology keeps providing new tools. But getting more data faster isn’t the same as knowing what to make of it. As I move into my final month before retirement, here are some thoughts on the rocky path that got us here and the unknowns that lie ahead.
Tests, tests and more tests
North Carolina made a name as an accountability pioneer with its ABCs of Public Education program in the late 1990s. That system included public reporting of test scores, with small teacher bonuses tied to results.
The nation got serious about scrutinizing test scores in 2001, when the bipartisan No Child Left Behind Act passed Congress. All states had to publish results and break them down by race and economic status, which highlighted national disparities. There were performance goals each year, and schools that fell short were required to offer transfers, tutoring and other measures designed to get everyone on grade level by 2014. Spoiler: It didn’t work.
The first thing you need for a system like that is tests that accurately gauge whether students know what they’re supposed to. The nature and the volume of testing was controversial from the start. Very few of us adults use our academic skills to answer multiple-choice exams — but how else could the state get quick, consistent scoring?
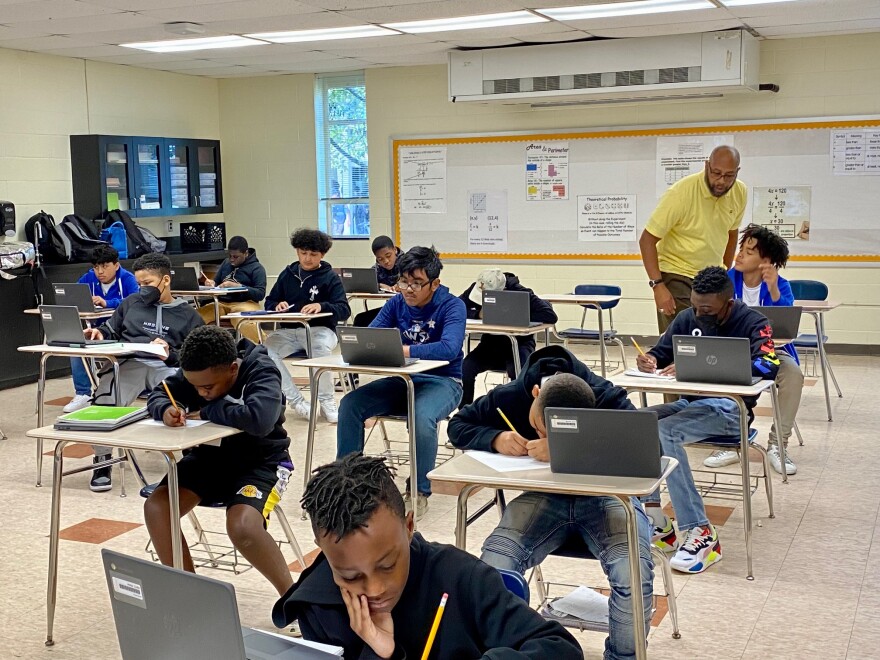
East Mecklenburg High students take exams in the school library in February 2022.
North Carolina had a writing test for years, with prompts like writing about exploring a huge castle appearing outside the your window (for fourth-graders) or making suggestions for spending a $500,000 school grant (for middle schoolers). Scores fluctuated wildly. In 2002 state officials puzzled over why so many fourth-graders tanked when asked to write about a great day at school. There were plenty of wisecracks, but no clear answers. The state abandoned the writing exams in 2008.
Even the multiple-choice tests provided inconsistent results. In the early 2000s, my colleagues and I filed regular reports on North Carolina’s quest to adjust testing. Every new version required field tests — and constant adjustments in testing made year-to-year comparisons meaningless. Parents and teachers complained that the time spent preparing for and taking exams was eroding time to learn. But that didn’t deter the quest for data.
In 2012, for instance, the General Assembly passed the Read to Achieve act. It tied fourth-grade promotion to third-grade reading test scores. The goal was to get all students reading on grade level by the end of third grade — something virtually everyone agrees is important. But even in the years before the pandemic set everyone back, the “social promotion” restrictions and the summer reading camps associated with Read to Achieve hadn’t brought about major gains.
And in Charlotte-Mecklenburg Schools, Superintendent Peter Gorman went all in on testing mania.
Using scores to rate teachers
Gorman, who was hired in 2006, had an admirable goal: Getting the best teachers into the schools where students were struggling. To do that he had to identify the best teachers. Experience and credentials provided only a rough guide.
He couldn’t assume that teachers whose kids had high scores were the best, because the highest-scoring students were generally those who came well-prepared. CMS needed teachers who could excel with disadvantaged kids.
The answer? Value-added ratings, designed to factor in previous scores, race, family income, disability and all the other things that shape performance on exams. Finding the formula to identify effective teachers was a holy grail for policymakers, philanthropists, education reformers and administrators across America in the first decade of the 21st century. Gorman was determined that CMS would take the lead.
He started a pilot program that linked pay to value-added ratings based on state exams. But he wanted to rate all teachers, from the person leading a kindergarten classroom to the high school art instructor. Gorman got $2 million in county money to create 52 new exams that would be used primarily to rate teachers. By 2014, he said, all teachers would have part of their paycheck tied to performance ratings.

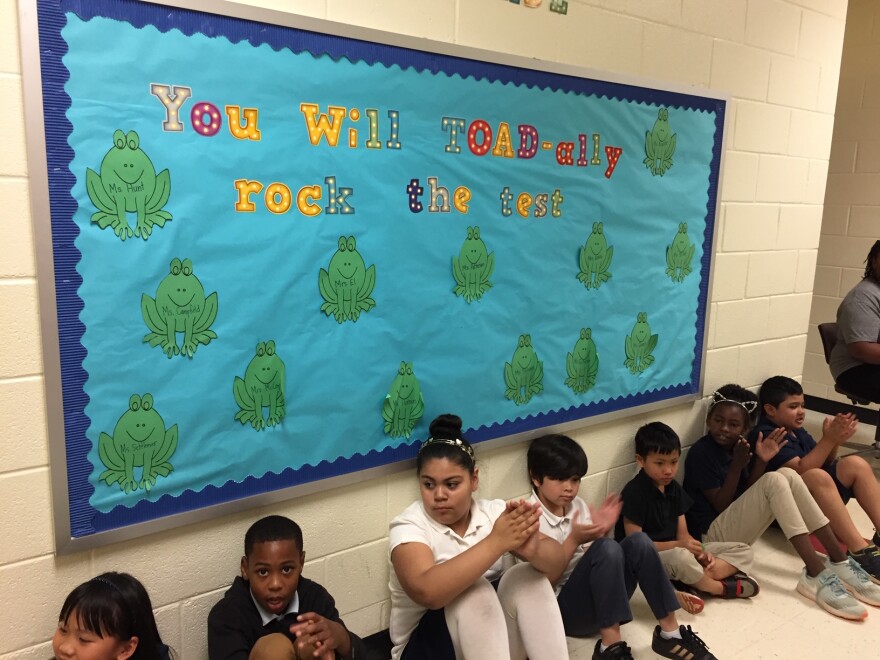
Many schools hold rallies and decorate bulletin boards to encourage students to earn high scores on North Carolina’s year-end exams.
Teacher reactions ranged from skeptical to furious. One high school math teacher told the school board the new ratings put him in the bottom 25%, but no one could tell him how to do better. How, he asked plaintively, would his students benefit from simply labeling him a failure?
Parents circulated petitions against the plan. Some threatened to keep their children home on testing days.
Gorman’s timing was abysmal: He had hoped to get money to reward highly effective teachers. Instead, the Great Recession struck and he ended up laying off teachers and closing schools. By the time Gorman took a job with Rupert Murdoch’s News Corp in 2011, his plan for test-based performance pay was dead.
But North Carolina’s value-added system was emerging. The state worked with the Cary-based SAS Institute to create the Education Value-Added Assessment System, better known as EVAAS. The state began using those ratings, which are based on student scores on state exams, in teacher evaluations in 2011. The following year North Carolina started posting EVAAS growth ratings for schools as well.
Sizing up schools
One of the most fascinating and challenging parts of covering education has been figuring out how to use accountability data. I’ve seen all the ways numbers can be misleading. Folks can cherry-pick numbers to spin a story. They can generate data that looks powerful but relies on flawed assumptions. And they can simply make mistakes.
I concluded that numbers never tell the whole story, but data can create a strong framework to ask good questions. That’s especially important for families making decisions about where their kids will go to school in an era of ever-increasing choice.
Back in the days when printed newspapers were the best way to get information to families, I worked with colleagues at The Charlotte Observer to select, verify and present the most meaningful numbers about their schools. The state was doing the same, with a much larger staff. And as the internet became pervasive, the state’s report cards became a convenient source for school data.
Still, making comparisons was a lot of work. In 2015, North Carolina jumped on a trend that originated with Florida Gov. Jeb Bush: Assigning schools the same kind of A-F letter grades that students got. Proficiency on exams counts for 80% of North Carolina’s school performance grades, while the EVAAS growth rating accounts for 20%.
The grades were immediately controversial, and remain so. They say more about the characteristics of the kids who show up than the quality of work done by educators. Why? Children who grow up in stable homes, with books and technology and college-educated parents, tend to pass state exams. Kids whose parents are struggling for survival, who are traumatized by violence and poverty, who don’t hear formal English until they report to school? They tend to fail.
A 2015 policy brief by education advocate Joe Ableidinger summed it up in a headline: “A is for Affluent.”
“What would you think if state legislators created a new A-F school grading system based on poverty, giving A’s and B’s to the schools that serve the fewest poor students while tagging the highest-poverty schools with D’s and F’s? Unfortunately, the current grading scheme produces the same result,” Ableidinger wrote.
But boy, are those grades compelling. We can’t resist ratings and rankings. When the grades came out each fall, I published “best and worst” lists — at The Observer and later at WFAE. They got far more page views than the accompanying analyses I posted.
Finally I quit doing the lists. Because let’s be honest: School letter grades reinforce segregation. D’s and F’s almost always go to schools populated by Black and brown students in poverty. And if you’re a parent with choices, doesn’t it feel almost negligent to send your child to a school that’s average or failing when you can pick a top-rated alternative? A higher grade doesn’t necessarily mean a better setting for your child, but a low grade can accelerate a school’s struggles by driving off good students and engaged parents.
Looking at two schools
Consider Coulwood STEM Academy in northwest Charlotte and J.M. Robinson Middle School in south Charlotte. Last year Coulwood was a C school and Robinson got an A.
But go to the state’s report card site and you can learn more about both schools. For instance, 59% of students at Coulwood were economically disadvantaged in 2023-24, compared with 15% at Robinson. (It’s not in the report card, but 86% of Coulwood students were Black or Latino, while 77% of Robinson students were white or Asian.)

Charles Smith teaches seventh grade math at Coulwood STEM Academy.
Predictably, Robinson’s proficiency levels are much higher than Coulwood’s – 83% of Robinson students passed reading exams, compared with 52% at Coulwood. But both schools got the highest possible ratings for academic growth. That means more of Robinson’s students arrived with at least grade-level skills, but both schools did an outstanding job of helping their kids move up.
Coulwood had more students participating in career-tech classes: More than 95%, compared with 74% at Robinson. Both schools outperformed CMS and the state at English learner proficiency.
Robinson had 17 National Board Certified Teachers (a voluntary credential that signals a high level of dedication and skill), while Coulwood had five. But 86% of Coulwood’s teachers were rated highly effective, compared with 43% of Robinson’s. Neither school had any teachers rated “needs improvement.”
Coulwood had above-average rates of suspension and chronic absenteeism when compared with CMS and the state, while Robinson was well below those averages. That’s typical for high- and low-poverty schools.
All of that is the kind of data that can help a family understand what’s going on at school.
What does it mean for policy?
I chose those examples because I knew they were two strong schools in different environments.
But I don’t want to sugarcoat the big picture: Data from many high-poverty schools will break your heart. Scores are abysmally low. Suspensions and absenteeism are high. Experienced, highly-rated teachers don’t take jobs there or quickly move on.
Identifying schools as failures is supposed to motivate change. But labeling turns out to be a lot easier than fixing. I’ve seen local, state and national turnaround efforts fall short. When one school cycles off the low-performing list, another always seems to cycle on.
So we have yet to achieve the ultimate accountability goal: Using numbers to make life better for students.
And we’re at a crossroads on how to pursue school ratings. There’s widespread, bipartisan agreement that the current letter grades are inadequate, but little progress toward improving them. For years, some legislators and advocates have pushed to give more weight to the growth rating, which would give high-poverty schools a better shot at top grades. But that hasn’t gotten traction in the state Senate.
There’s also a push to go further and embrace complexity.
Two years ago state Superintendent Catherine Truitt convened a group to come up with a better school rating system. The group polled thousands of students and parents, consulted with educator associations and enlisted leaders of 52 districts and 36 charter schools to explore options.
The result was a report, published in January, proposing a system that goes beyond test scores. It calls for incorporating such things as career preparation, chronic absenteeism, extracurricular activities and results of student and teacher surveys. Most intriguing – and challenging – the plan calls for figuring out ways to measure whether schools are cultivating such “durable skills” as collaboration, communication, critical thinking and empathy.
In February Truitt pitched a new grading system to the House Select Committee on Education Reform. It would give each school four grades, representing academics, progress, opportunity and readiness. The new system would require creating new data systems, and Truitt’s plan called for pilots to start in the coming school year. By 2027-28, the report said, it might be feasible to track durable-skills data.
But the General Assembly took no action to authorize a pilot, which means the effort is already behind schedule. And Truitt’s defeat in the Republican primary means she’ll leave office after the November election.
In other words, don’t expect big changes in the school performance grades anytime soon.
A minimalist approach
On the flip side, Republican leaders in the General Assembly seem to think less data is fine, at least when it comes to private schools that get public money. They’ve dramatically expanded the Opportunity Scholarship program — it’s distributing $293.5 million this year, with more to come — while requiring virtually no public release of data.
“The ultimate metric of accountability is the family and the student,” Sen. Michael Lee, a Hanover County Republican, told his colleagues in 2023.

Rachel Brady is a mother of four who organized a rally outside the legislature July 31 to call on Republican lawmakers to clear the waitlist for Opportunity Scholarship vouchers.
The voucher program arose from a desire to offer low- and moderate-income families alternatives to failing public schools. Those schools, of course, are known as failing because we scrutinize their data and the state publishes annual low-performing school lists. But we don’t know whether struggling students do better in private schools. And the same policymakers who demand transparency from public schools are willing to trust private-school operators to provide parents with accurate information.
It strikes me that intellectual consistency would lead to the elimination — or at least a dramatic reduction — of data-gathering, disclosure and school ratings when it comes to public schools. I wrote recently about the consumer paradigm involved in school choice. We could, in theory, trust school boards and principals to tell us how things are going — and add one more market-based perspective: Caveat emptor. Let the buyer beware.
I’m not seriously arguing for that approach, and I haven’t heard anyone else do so. But I am puzzled by our state’s inconsistencies.
Which brings me to one more form of accountability: The ballot.
The race for president is dominating the news. But it’s worth remembering that state legislators and the superintendent of public instruction are also up for election in November. If you care about education, this is a good time to tune in.
Source link : http://www.bing.com/news/apiclick.aspx?ref=FexRss&aid=&tid=66b220db46344e8da3dd4870aa4aecf8&url=https%3A%2F%2Fwww.wfae.org%2Feducation%2F2024-08-06%2Fnorth-carolina-grades-its-schools-but-is-it-improving-them&c=3942565456203504058&mkt=en-us
Author :
Publish date : 2024-08-06 01:55:00
Copyright for syndicated content belongs to the linked Source.

